Many people think that Google ads reporting is difficult to get a handle on. They might wonder why it’s so important or how they can use the reports in their own advertising campaigns. We are here to tell you all about Google Ads Reporting and what makes them great for your business!
In this blog post, we’ll discuss everything you need to know about Google Ads Reporting, including features of the reports themselves and how you can put them to work for your company. Let’s start.
What Is Google Ads Reporting?
Google Ads reporting is the tool that allows you to know how your ads are performing. You can get a breakdown of what each ad campaign has generated in terms of impressions and clicks, as well as an analysis of which landing pages were most effective at driving conversions.
The Google Ads reports let you know the post-click performance of your ads by recording metrics for users who clicked on them and then came to visit your site, downloaded an app, or made a purchase.
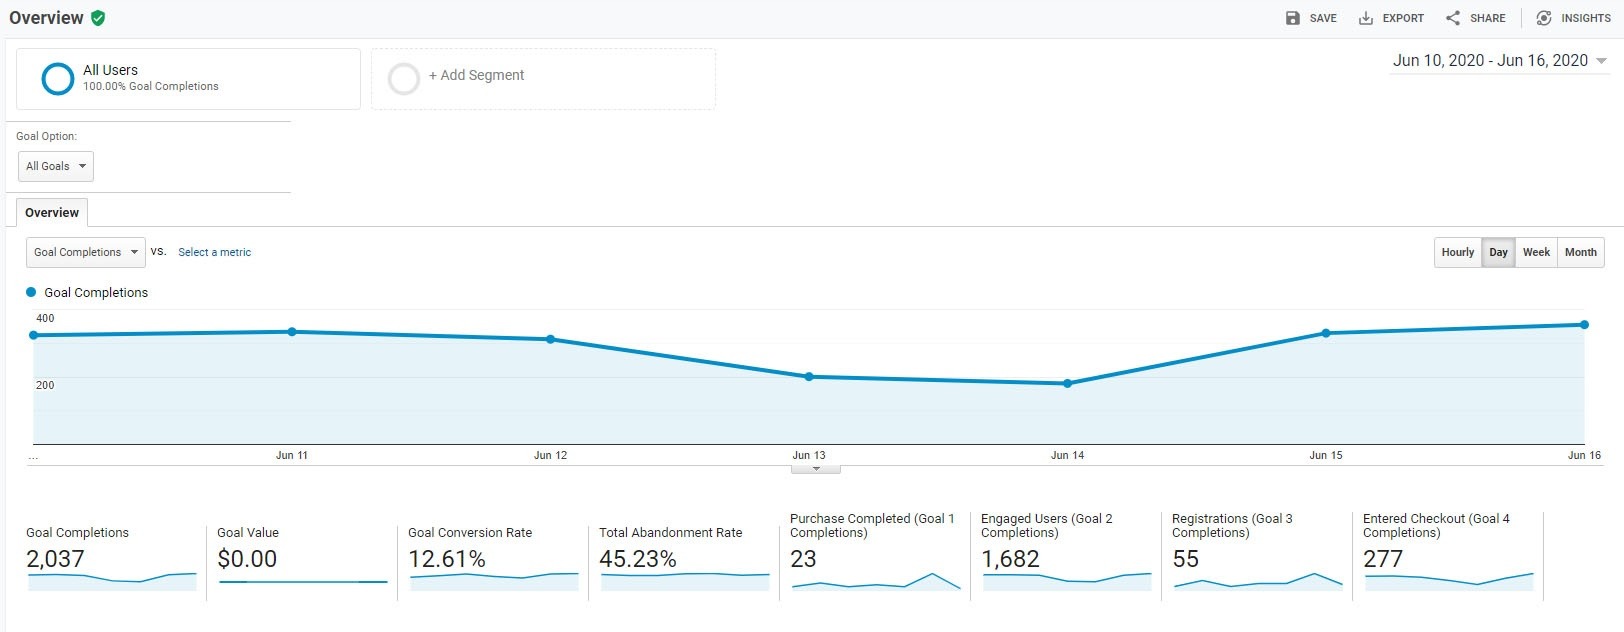
Google Ads report gives you an insight into your users’ ABC (Acquisition-Behavior-Conversion) cycle: your user acquisition process, their engagement with your app or site after you acquire them, and how long they stay before converting.
This data helps marketers optimize their campaigns with better targeting or more focused messaging.
Importance of Google Ads Report
A Google Ads report is a document that provides an overview of your campaign’s performance. Below are some reasons to use this report;
- It provides information on metrics such as Cost/Conversion & Traffic Sources to Conversion Rates by day or hour. Understanding how these metrics work together will help you better understand the effectiveness of your ad campaigns over time.
- Cost per conversion: How much it costs for every conversion (i.e., someone who clicked on one of our ads then made a purchase). This metric helps determine if your budget expenditure matches what is required in order to meet marketing objectives;
- Traffic sources to conversion rates: This shows where visitors are coming from when they make purchases after clicking on an ad, and how effective those ads are for meeting marketing goals. Knowing these numbers will help you better decide which traffic sources to prioritize when targeting your audience.
Do you want to start advertising your business on Google or maximize your current advertising?
Read about our Google marketing services and contact us today!
How to Create Google Ads Report?
Here you have two options. You can either choose from a set of ‘predefined reports’ or you can create a new one from scratch.
How to open a report from ‘predefined reports’?
This is a huge time saver! Google Ads comes with a set of pre-made reports that are already designed to answer specific questions. These can be used as a starting point for the report you want to make and then edit it accordingly.
Here’s how you can open one;
- Sign in to your Google Ads Account.
- Click on the reporting icon
. (At the upper right corner)
- Select ‘predefined reports’ and choose one of the reports to open in the report editor. Done!
How to Create a Custom Report?
At times, the predefined reports don’t show the information you need in a way that works best for your needs. The Report Editor tool lets you define those requirements more specifically by dictating how to display different types of data in tables or charts.
Here’s how you can create one;
- Sign in to your Google Ads account.
- In the upper right corner of your account, click the reports icon
- Click
Custom and choose the type of chart you’d like to create: Table, Line, Column, Bar, Scatter, or Pie.
- Once you are done creating, click Save or Save as to save the report.
For in-depth instruction visit here.
Important Metrics to Track
The most important metrics to track when it comes to Google Ads Reporting are CTR, CPC, conversion rate, and cost-per-conversion. Let’s break down these four statistics so you know how they should be tracked and what each metric means for your business:
- CTR represents the percentage of people who have clicked on an ad after viewing it on a search engine results page.
- CPC is calculated by dividing total costs by clicks received. Cost per conversion will help you find optimal bid prices in order to make more money from Google Ads Campaigns.
- Conversion Rate refers to the number of conversions divided by impressions (the overall number of times one person has seen or been exposed to your advertising).
- Costs per Conversion represent how much money you’re spending as compared with revenue generated from those conversions. That value can then help in finding the optimum bid price to increase your profit margin.
Once you have a complete understanding of all these matrics we are confident that you can formulate a sound Google ads campaign strategy or determine the effectiveness of the current ones.
Google Ads Reporting Best Practices
Google Ads reporting is an important part of any Google ads campaign. Not only does it provide vital information on how the ads are performing, but it also enables advertisers to analyze and optimize their campaigns in order to maximize ROI. Here are some google ad reporting best practices that you should be sure to employ if you want your marketing efforts to succeed.
- Make sure all reports are set up with goals: The first google ad report best practice is setting up google analytics goals for each individual report so that appropriate data can be collected and analyzed.
- Utilize conversion highlighting: This google advertising tool allows marketers to easily see which keywords or placements have the highest number of conversions. This Google ad reporting best practice is a great way to optimize your campaign based on the performance of individual keywords or placements.
- Make sure you’re analyzing data from an appropriate date range: We recommend looking at google ads reports over the course of 30 days so that enough data can be collected and analyzed accurately. This google advertising tool will show how campaigns are performing compared against one another, as well as which time periods convert better than others.
- Utilize segmentation options: Google AdWords gives advertisers the option to group their statistics by keyword, placement, device type, operating system version, etc., in order to make it easier for marketers to analyze specific aspects of their campaign without having to spend hours trying to figure out where they need.
- Enable auto extensions: This google ads reporting best practice is useful for advertisers who are constantly running google ads campaigns. Google AdWords will automatically extend your campaign if the time limit has expired, which means that you don’t have to sit around and wait until it’s over before analyzing how much of an effect your google advertising dollars had on your business goals.
- Check what type of conversion this google ad report shows: The last step in any google advertising analysis should be to compare conversions from different types of user actions - some might want purchases while others may prefer signups or registrations.
Google Analytics- Get More Insights from the Reports
Google Ads and Google Analytics have a way of exchanging information with each other that is valuable for both platforms.
This exchange helps you to use the two services to their fullest abilities, which can help you get the big picture on your performance as well as find ways in which it could be improved.
Linking Google Ads and Analytics can help you take advantage of the tools that each platform has to offer. You don’t have to use both platforms at once, but when they are combined into one unified system with data exchanging capabilities it is easy for marketers like yourself to analyze your performance and see what needs improvement or tweaking.
Furthermore, since there are so many third-party integrations available through this combination program you’ll be able to find new ways in which these two great tools can improve your marketing!
Final Words
That’s all for today. We hope you now have a better understanding of Google Ads Reporting and the metrics that matter to your business. If you don’t have time to learn everything or analyze every metric, then we recommend putting things in safe hands like ours.
With team Kubla’s help take your google ads campaigns to a whole new level of success. Our teams of expert digital marketers have experience working in various industries. We’re also affordable with packages designed specifically for small businesses looking to grow their business online.
Feel free to reach out if you’d like more information or want us to take over some or all of your campaign management needs!

- Lorem ipsum dolor sit amet.
- Lorem ipsum dolor sit amet.
- Lorem ipsum dolor sit amet.
Read more about the topic
Google Ads Conversion Tracking
7 Conversion optimization tips for better results